Learning centre
Learn to read markets, one short lesson at a time
24 short, original lessons in 6 tracks, with live chart examples, and a glossary of 110 trading terms. Free, no account needed.
1. Market basics 4 lessons · 4 min
What moves prices, how orders meet, and the words every chart uses.
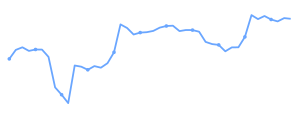
A price is the last trade between a buyer and a seller. It moves when one side is more eager than the other.
1 min read3 questions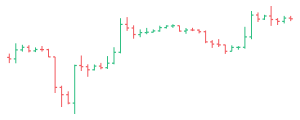
A market order takes the best price now; a limit order waits for your price; a stop order wakes up when price reaches a level.
1 min read3 questions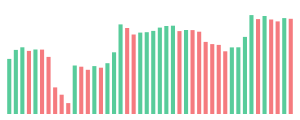
The costs every trade pays, and why small costs matter more than they look.
1 min read3 questions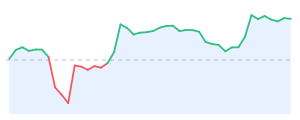
Leverage lets a small deposit control a large position. It multiplies losses exactly as much as gains.
1 min read3 questions2. Reading charts 5 lessons · 5 min
Candles, timeframes, trends, support and resistance.
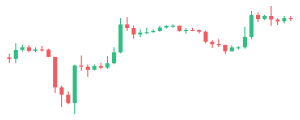
Each candle shows the open, high, low and close of one period.
1 min read3 questionsLive chart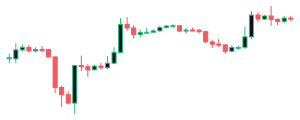
The same market looks different on 5-minute and daily candles. Use more than one.
1 min read3 questions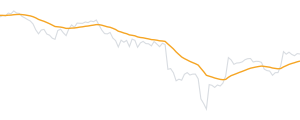
An uptrend is a series of higher highs and higher lows; a downtrend the reverse.
1 min read3 questionsLive chart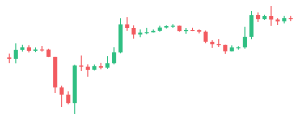
Prices where many traders acted before tend to matter again.
1 min read3 questionsLive chart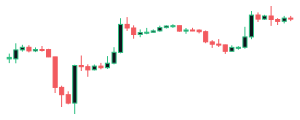
Triangles, flags, double tops and head and shoulders describe how a fight between buyers and sellers resolves.
1 min read3 questions3. Using indicators 4 lessons · 4 min
What the main indicator families measure and how to combine them without fooling yourself.
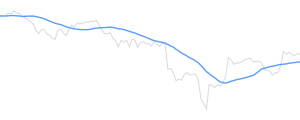
An average of recent prices that smooths noise and shows direction.
1 min read3 questionsLive chart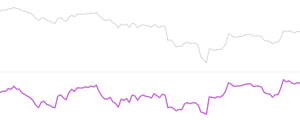
Oscillators measure momentum. Extremes show stretched moves; divergences show tiring ones.
1 min read3 questionsLive chart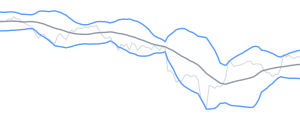
How much a market usually moves, used to size stops and spot quiet periods.
1 min read3 questionsLive chart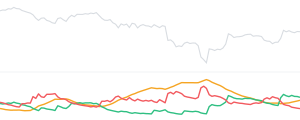
Use indicators that measure different things, and test the combination.
1 min read3 questions4. Risk and position size 4 lessons · 4 min
The part that decides whether a trader lasts: stops, size, leverage and drawdowns.
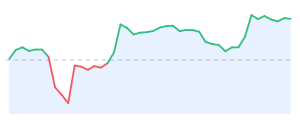
Decide the money you are willing to lose first; the position size follows from the stop.
1 min read3 questions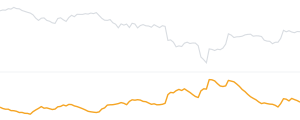
A strategy that wins 40% of the time can make money if winners are bigger than losers.
1 min read3 questions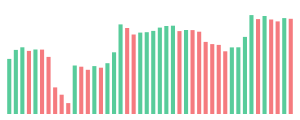
Losses are part of every strategy. Plan for the streak before it happens.
1 min read3 questions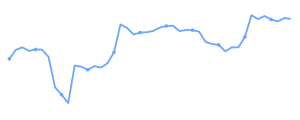
Writing down why you traded turns random results into lessons.
1 min read3 questions5. Order flow 4 lessons · 4 min
Volume, delta, footprints and the order book: who is actually trading.
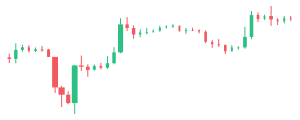
Volume is how much traded. Moves on rising volume have more participation behind them.
1 min read3 questions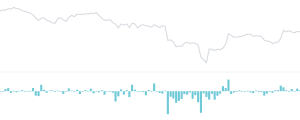
Delta is buying minus selling by aggressive traders in each candle.
1 min read3 questionsLive chart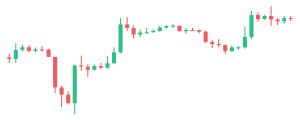
A footprint splits each candle into price rows showing buying and selling at every price.
1 min read3 questions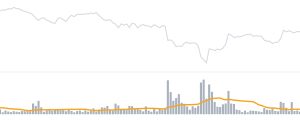
Resting orders show where trading may slow down or speed up, but they can be pulled at any time.
1 min read3 questions6. Testing strategies 3 lessons · 3 min
How to backtest honestly and why most backtests lie.
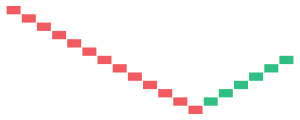
A backtest replays a rule on past data to see how it would have done, with costs.
1 min read3 questions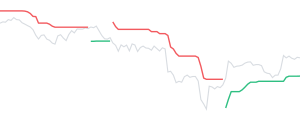
The two main reasons a good-looking backtest fails live.
1 min read3 questions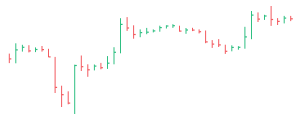
Profit is the least informative number. Look at drawdown, consistency and trade count.
1 min read3 questionsReference
Pictures are drawn from the latest hourly Bitcoin candles from Binance. Progress is kept in this browser. Education only; nothing here is financial advice.