Timeframes
The same market looks different on 5-minute and daily candles. Use more than one.
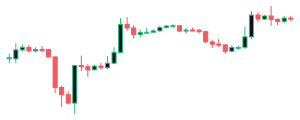
Higher timeframes set the direction
A daily uptrend can contain hours of falling prices on a 5-minute chart. Many traders decide the direction on a higher timeframe and time entries on a lower one.
Noise grows as the timeframe shrinks
Small candles are moved by single orders, news and spreads. Signals on them are more frequent and less reliable, and costs weigh more against small moves.
On Candlesview
Any indicator can run on a higher timeframe than the chart, and the strategy builder has a higher-timeframe trend filter. Tick bars group a fixed number of trades instead of time.
Try it
Check what you took from it
3 questions on this lesson. With at most one wrong answer the lesson is marked as done in this browser; nothing is sent anywhere.
Terms in this lesson
Education only. Nothing here is financial advice or a recommendation to buy or sell anything; trading involves a high risk of losing money.